
Tuesday, 27 September 2011
Monday, 26 September 2011
Coolinfographics

This info graphic has shapes in it which relates to beams of light, I am imaging that this image is turned 90 clockwise and the coloured lights are shining up into the floor... each beam is representing an individual and the writing is the name of that individual. Everywhere that the individual walks, the light follows.

I can imagine this infographic being represented as a floor space where the denser coloured areas are brighter due to the fact that there are more people standing in the area. The different images and colours could represent the types of people standing in that area or for how long the people have been in that area. This could be a useful analysis to determine efficient circulation for a large room that has a lot of people ocming and going... the people in the middle and out to the sides might be finding it difficult to get to the exit areas hence the reason for the centre to be so packed.


The 4x infographics above are chosen purely for aesthetics. This kind of imagery would be great for the kinds of lights that could be used or even for the effect that the lit floor tile effect. It has also given me ideas how I could represent HUD messages. To get HUD messages to display using lights or holographoc kind of materials could really benefit this experiment... something to go and research now....
This is a great video that Ros showed me which demonstrates how data is being represented digitally.
Review for Analytics Engine
"How will your Analytics Engine allow a viewer to draw conclusions that would be difficult (or impossible) to reach by interrogating the data in its raw form?"
At this point in time it is already difficult to understand exactly what is going on in terms of the data from the pachube feed (this is most likely because the feed is not live). In saying that, I need to think further than what the pachube feed is currently monitoring. To do this, the best thing would be to literally create a crysis version of what the pachube feed is getting data of and take it form there. This way I can work creatively in crysis and I can let my ideas develop in a different way to what I am used to. I need to keep in mind while doing this that the "light" could become something like particle effects, projector lights or even walls appear. The room could literally get larger and larger. Another idea could be that the AI's who enter the room could glow, or their clothing becomes brighter depending on the amount of time spent in the room.
Notes from Discussion re: Flowgraph
My idea of how I might use the flowgraph from last week to represent the data from my chosen pachube feed was very literal. The data would be collected from the amount of time that that a person is spent in the room, also from the amount of people that are in the room. Or I would create the data to control AI's.
To make a more interesting concept and something that is more original I need to get in touch with the ARCH1391 student to find out more information such as...
- what is the room like that this will happen in
- how big is the room
- what are the units measuring in the pachube feed
Basically, I need to find out more about the data!
This is the link I need to access the blog for the ARCH1391 student who's feed I am using for data.
http://dcs-2011.ning.com/profiles/blogs/module-2-week-9-refined-design-plan-and-github-code
This is the link I need to access the blog for the ARCH1391 student who's feed I am using for data.
http://dcs-2011.ning.com/profiles/blogs/module-2-week-9-refined-design-plan-and-github-code
Saturday, 24 September 2011
250 Word Brief for Analytics Engine
ok... so if we are tracking the analytics from the pachube feed that means that I could use the data to control the characters, ie. as the data presents values that are going up, more and more characters appear in a room. A flowgraph would then be created to control the light intensity according to the amount of people in the room at any given time.
BUT, if I am using the data from the Pachube feed as a basis for creating my own data, I could create pathways for characters to arrive and enter the room at different times and for different periods which is sent back to the xml doc which then controls the light intensity.
I need to come back to this!!
Using Tutorial Flowgraph to Analyse Pacube Feed
I'm not sure that I totally understand how I can link the flowgraph to 'analyse' the data from the feed so I tried to sketch it out.

The only problem with this idea is that it is literally acting on the data from players moving into the area rather than being a representation of the data just being fed in from Pachube.
At this stage I'm a little confused...

The only problem with this idea is that it is literally acting on the data from players moving into the area rather than being a representation of the data just being fed in from Pachube.
At this stage I'm a little confused...
Monday, 19 September 2011
Research
I will continue to add information and links to this post for research...
______________________________________________________________
To start off I wanted to add this basic but very useful piece of information on the types of data that can be linked between nodes.
Types of Data
In a flowgraph there are different kinds of information that can pass from a node to another, the type of information that’s outputted from a node can be seen from the output’s arrow color:- Dark Blue: Boolean value (0 for false / 1 for true)
- Light Blue: String (this can contain numbers and letters, e.g "Mission Success" or "The Code is 1234" etc…)
- Red: Integer value (whole numbers such as 0, 1, 2 etc…)
- White: Float value (numbers that can include decimal places eg. 0.23, 4.738 etc…)
- Pink: Vector (a position or angle in relation to the map eg. (1,0,1), (23,1,2); etc…)
- Green: Any/Signal - this kind of port can pass all the above types of information through.
Usually you can link an output to an input only when they are of the same kind; you can link everything to a green input/output, but be sure that the data that arrives to the input is of the right type. However, compatible ports (integer to float for example) are allowed to link together; you will recieve an error message of your linking is incorrect.
______________________________________________________________
I found this tutorial which could possibly help me with what I was trying to do for the Week 1 task. It would also be useful in data analysis to change material parameters on objects as AI's get closer/ further away or time of day changes (for example).
Flowgraph Walkthrough
The String:SetString nodes contain the file paths to the new material which are to be assigned to our object. In this example on game start every 5 seconds the material of the object will change. The string paths of the materials are sent via a Logic:Any node to the Entity:Material node which performs the material swtiching.


I found this on Ros's blog which again could help me.
______________________________________________________________
Flowgraph Tutorial
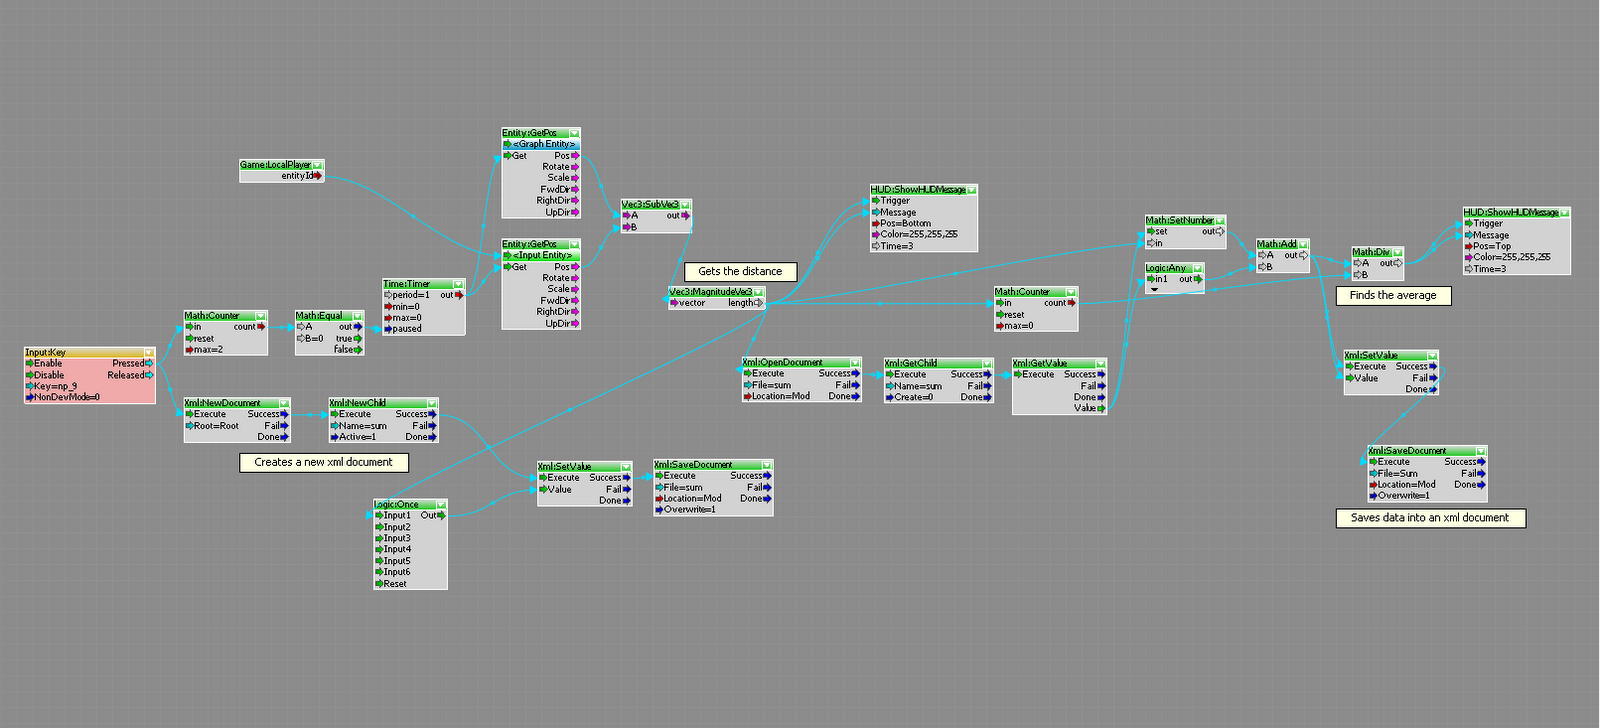
This flowgraph creates data that measures the distance between the player and the object over a certain amount of time. It stores the data in an external xml docment which gives the total distance covered over that time frame.

This section of the flowgraph creates a new external xml document called 'sum' which is saved in the mods folder.

This section of the flowgraph finds the distance between the player and the object.

This section of the flowgraph finds the total average of the distance covered between the player and the object.
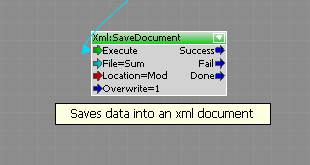
This section of the flowgraph saves the data into the 'sum' xml docuement.
S.W.O.T Analysis of Pachbe Feed
I have chosen Creating Space with Light Pachube feed from ARCH1391.
"The sense of space is created using light. The number of people entering and leaving a room directly correlates to the floor area which is lit up. As more people enter the room the lit floor area increases. As more of the floor area lights up the concept of a larger space is created."
There is currently no data available.
__________________________________________________________
S.W.O.T Analysis
Strengths
This idea is innovative and could quite easily lend itself to architecture in sustainability. Rather than having a fixed amount of light for a defined space (being the same for both 1 person in the room as 100 people in the room) the becomes organic in that it is ever changing in tune with the amount of people that are in the room. There is no need for a switch to be flicked as one enters the room and the. There is also the possibility that as more people enter the room the brightness of the light will give a sense or a larger space, avoiding the potential concern to leave a room due to overcrowding or feeling enclosed.
Weaknesses
Firstly, there is a possibility, if the right lights are not used, that the increasing light could cause an obstruction to ones vision. As light shines upwards it is directed into ones eyes, and therefore, when the light is at it's brightest, it could feel like you could not escape the sense of light beaming into your vision. Secondly, light is usually directed in-line of vision and one can connect with light in the direction of where they are looking. If light is coming up from the ground, it could potentially give a sense that there is something looking up from below.
Firstly, there is a possibility, if the right lights are not used, that the increasing light could cause an obstruction to ones vision. As light shines upwards it is directed into ones eyes, and therefore, when the light is at it's brightest, it could feel like you could not escape the sense of light beaming into your vision. Secondly, light is usually directed in-line of vision and one can connect with light in the direction of where they are looking. If light is coming up from the ground, it could potentially give a sense that there is something looking up from below.
Opportunities
In regards to an entertainment centre environment, this idea could be used for light shows, as more and more people enter the hall the brighter the light show gets. Having a light show on the ground would be an interesting concept at a concert. In a museum/ art gallery this idea could be used to firstly create the sense of space that this idea is initially based on, but also to create information about how many people are in a particular area of the gallery. If, for example, you could see light coming from a part of the gallery you would know to maybe come back later as there is obviously lots of people already in that room.
In regards to an entertainment centre environment, this idea could be used for light shows, as more and more people enter the hall the brighter the light show gets. Having a light show on the ground would be an interesting concept at a concert. In a museum/ art gallery this idea could be used to firstly create the sense of space that this idea is initially based on, but also to create information about how many people are in a particular area of the gallery. If, for example, you could see light coming from a part of the gallery you would know to maybe come back later as there is obviously lots of people already in that room.
Threats
I'm not sure exactly of what is meant by 'threats' but I can imagine there would be threats to eyesight if the incorrect type of lights were used. Or there could be threats to budgets, as I could imagine that making a floor that was lit would be very expensive!
I'm not sure exactly of what is meant by 'threats' but I can imagine there would be threats to eyesight if the incorrect type of lights were used. Or there could be threats to budgets, as I could imagine that making a floor that was lit would be very expensive!
EXP 2: Analysing Parameters Vid
The parameters that are being analysed in this video is the height that the AI's are at in the environment ie. as the AI walks up the stairs it gets to a higher height.


Subscribe to:
Posts (Atom)