Thursday 10 November 2011

Final Submission: Research


_______________________________________________________

500 WORDS

RESEARCH INTO “GAPS OF KNOWLEDGE”
Changing materials and using material parameters is very commonly used in the Crysis Sandbox2 Editor. Using custom materials is a way of making objects, levels and entities look unique and individual. Changing material parameters is also a great way to create interesting information and displays within the game. There are many tutorials currently out there that tell us how we can create our own custom textures, how we can apply these to our own objects and have them change over time and how we can use the crysis materials within our own level. What I have found through my research is that there is not any information out there as to how to change the material of a preset set crysis object of any particular level. My tutorial will explain how to do this using a moving entity.

TUTORIAL LEVEL
The tutorial level will be for experienced users. They should have an assumed knowledge of being able to create their own level inside their own mods folder to do this tutorial within that. In that level, it is assumed that they can set up a moving entity, in this case, an AI who will follow an AI path up a flight of stairs so that we can have variable heights to record. The user will also know how to create a basic object in crysis and apply their own custom texture to it to be able to use in crysis. This is the point where the typical experienced user should be, the next step that my tutorial will take is being able to show the user what they can do with that custom texture once it is in a crysis level.

TUTORIAL SUBJECT
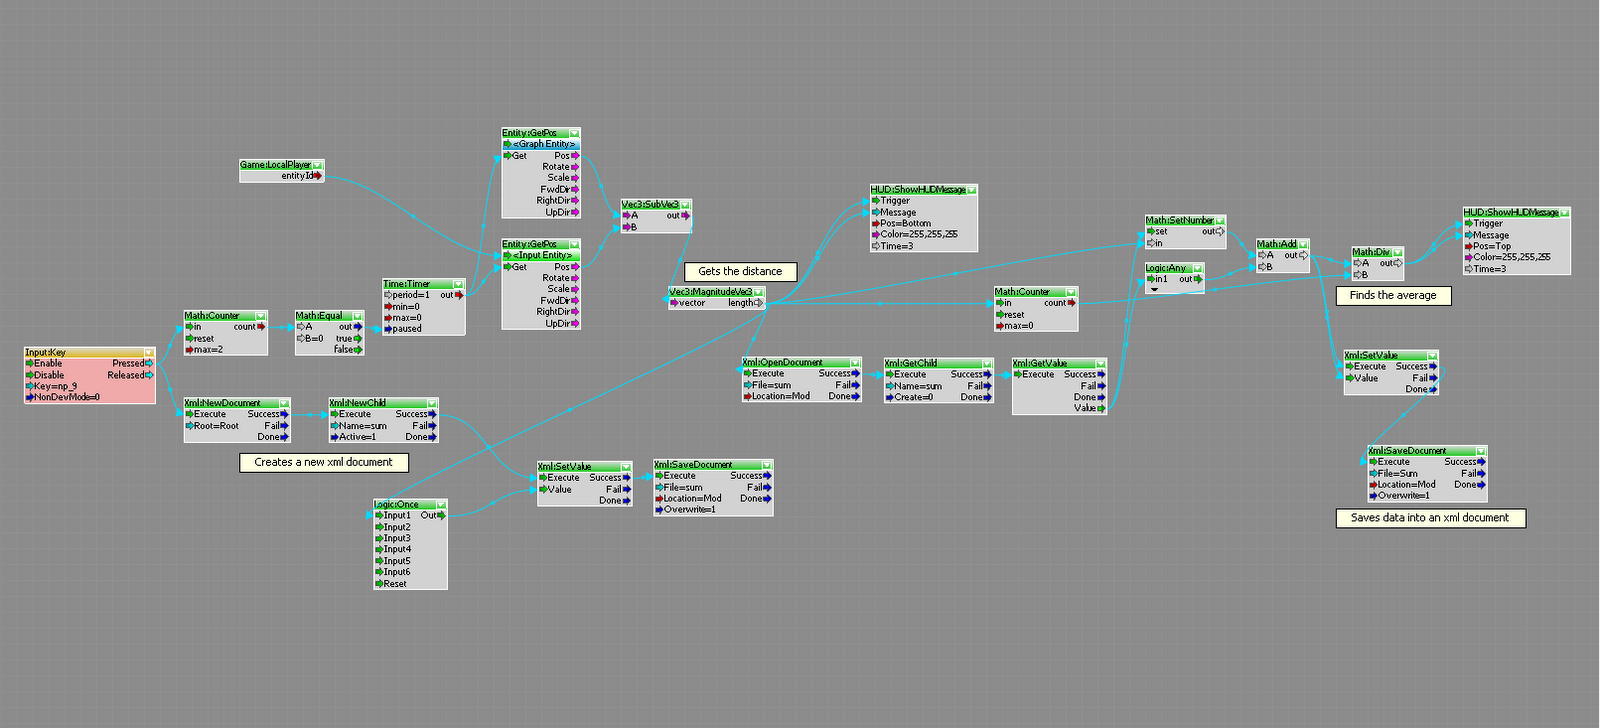
The tutorial itself is really a round-about way of creating custom textures that are actually crysis textures. It involves firstly creating your own custom texture and then creating a duplicate of that so that we can edit the .mtl file and keep the original custom texture. The edited version is basically a copy of the original crysis .mtl file, so in a way, we are tricking crysis to show a pre-set crysis material as a custom material. This allows us to use the crysis material in our flowgraph plugin system so that we can have it change in accordance with a moving entity.

In the past, I would think that the only way to have done this would have been to have two of the same objects in a level (both with different materials) and have one showing at a certain level and then swap it out for the other at the next level. My tutorial will be able to cut out the unnecessary extra objects and get straight to the material itself. A great way to save space, time and to create more interesting custom levels within crysis.

Final Submission: Analytics Engine


LINK TO OBJECTS FOLDER

LINK TO LEVELS FOLDER

Monday 10 October 2011

Paragraph on Tutorial Subject

A paragraph describing how the the tutorial subject you've decided on will elevate one's understanding of the media beyond that of a typical user. 

I have chosen to do my tutorial on how to change the pre-set crysis materials in the levels using a moving entity. I originally decided to do this when I was trying to do the week 1 task of EXP 2. Initially I thought that this would be quite an easy thing to do but I soon found out that a lot of the tutorials that I found were only for changing materials on your own imported objects/ entities and with using your own materials.
With a lot of help from Jules and some persistance, we were able to figure out how to change the pre-set crysis materials. This tutorial will therefore be a new way of looking at using materials with sandbox and hopefully it will be something new out there.

Second Draft of Analytics Engine

I've chosen to post this picture as I found the concept very interesting. It is a digital museum where they have kept the look and feel of a traditional museum butt they have used technology such as iPads to access the information... even though it feels as though you could access the information first hand. I would like to have an iPad situated at the entrance to the room where guests would enter their login details and "log in to facebook". Once they were inside the room they would be connected via facebook and socialising that way.

This image shows how the information would be displayed. This amount of information would be the maximum and it would be visible on the people who have been in the room the longest. It is an analysis of how well you can get to know someone by how long you have known them. Juxtaposed by the fact that you're really not getting to know anyone at all... it is just data that is visualised from a social networking website.
I have chosen to use the same colour sheme as facebook as I think this will help the viewer connect quickly to the idea that this is 'real-life facebook'.

2x Marking Schedules from BENV2423-2010


Paragraph on Research Assignment

The tutorial subject that occupies the intersection between your work in EXP1 or EXP2 and one of the gaps in the body of knowledge.

Throughout both EXP1 & EXP2 I have come across and have done a number of "changing material parameter" tutorials. It seems to be fairly straight forward to change materials on your own objects/ entities and on newly imported crysis objects/ entities.
What I have foud difficult is changing the material parameters on the objects that are already set in the crysis environment. For example, the video in the Wk1 tut for EXP2 shows the materials changing on a building already set within the crysis environment.
Jules spent a bit of time with me to help me figure out how to do this. By duplicating a crysis material and editing the material in its text document, you can change a crysis object material to your own.
We found that the material param change worked when using a "to" or "from" node but it didn't work with an "in range" node. 
Something I need to look into.

First Draft of Analytics Engine Documentary


Wk 4: Flowgraph

Week 4: Demonstration

Review of Infographics

I discussed my concept which has evolved form my infographics today with Jules. 
My idea has come mainly from the infographic title "The HBO Recycling Program". If you could imagine the image turned 90 degrees clockwise, the coloured circles represent the lights under the floor which correspond to the people that enter the room. The more people that enter the room, the more of the lights turn on. The different colours could represent the persons emotions/ mood for example.
I would also like to make the actual person invisible and replace them with their actual name in text, so this infographic is a direct representation of what my analytics engine would look like. Jules suggested that I could turn the AI invisible by making it have no mesh. I could then attach an object which is the text so that the text is walking around. Ideally I would like to look into HUD messages and see if there is anything that I could use that way.
After reading more about Margarets concept on the ARCH1391 blog I have realised that she is trying to connect the light in the room with sociability. The light is meant to disperse after a certain amount of time to encourage people to move about and become more sociable. From this I have thought about making the text that replaces the AI to display more information about the person the longer that they are in the room, ie. the longer the AI is in the room, the more about them you get to know. It would be a play on facebook, where the more time you spend on someones page, the more information you start to gather about them.

Monday 26 September 2011

Coolinfographics

This info graphic has shapes in it which relates to beams of light, I am imaging that this image is turned 90 clockwise and the coloured lights are shining up into the floor... each beam is representing an individual and the writing is the name of that individual. Everywhere that the individual walks, the light follows.

I can imagine this infographic being represented as a floor space where the denser coloured areas are brighter due to the fact that there are more people standing in the area. The different images and colours could represent the types of people standing in that area or for how long the people have been in that area. This could be a useful analysis to determine efficient circulation for a large room that has a lot of people ocming and going... the people in the middle and out to the sides might be finding it difficult to get to the exit areas hence the reason for the centre to be so packed. 

The 4x infographics above are chosen purely for aesthetics. This kind of imagery would be great for the kinds of lights that could be used or even for the effect that the lit floor tile effect. It has also given me ideas  how I could represent HUD messages. To get HUD messages to display using lights or holographoc kind of materials could really benefit this experiment... something to go and research now....

This is a great video that Ros showed me which demonstrates how data is being represented digitally.

Review for Analytics Engine

"How will your Analytics Engine allow a viewer to draw conclusions that would be difficult (or impossible) to reach by interrogating the data in its raw form?"

At this point in time it is already difficult to understand exactly what is going on in terms of the data from the pachube feed (this is most likely because the feed is not live). In saying that, I need to think further than what the pachube feed is currently monitoring. To do this, the best thing would be to literally create a crysis version of what the pachube feed is getting data of and take it form there. This way I can work creatively in crysis and I can let my ideas develop in a different way to what I am used to.  I need to keep in mind while doing this that the "light" could become something like particle effects, projector lights or even walls appear. The room could literally get larger and larger. Another idea could be that the AI's who enter the room could glow, or their clothing becomes brighter depending on the amount of time spent in the room.

Notes from Discussion re: Flowgraph

My idea of how I might use the flowgraph from last week to represent the data from my chosen pachube feed was very literal. The data would be collected from the amount of time that that a person is spent in the room, also from the amount of people that are in the room. Or I would create the data to control AI's.
To make a more interesting concept and something that is more original I need to get in touch with the ARCH1391 student to find out more information such as...
- what is the room like that this will happen in
- how big is the room
- what are the units measuring in the pachube feed
Basically, I need to find out more about the data!

This is the link I need to access the blog for the ARCH1391 student who's feed I am using for data.
http://dcs-2011.ning.com/profiles/blogs/module-2-week-9-refined-design-plan-and-github-code

Saturday 24 September 2011

250 Word Brief for Analytics Engine

ok... so if we are tracking the analytics from the pachube feed that means that I could use the data to control the characters, ie. as the data presents values that are going up, more and more characters appear in a room. A flowgraph would then be created to control the light intensity according to the amount of people in the room at any given time.
BUT, if I am using the data from the Pachube feed as a basis for creating my own data, I could create pathways for characters to arrive and enter the room at different times and for different periods which is sent back to the xml doc which then controls the light intensity.

I need to come back to this!!

Using Tutorial Flowgraph to Analyse Pacube Feed

I'm not sure that I totally understand how I can link the flowgraph to 'analyse' the data from the feed so I tried to sketch it out.


The only problem with this idea is that it is literally acting on the data from players moving into the area rather than being a representation of the data just being fed in from Pachube.
At this stage I'm a little confused...

Monday 19 September 2011

Research

I will continue to add information and links to this post for research...
______________________________________________________________

To start off I wanted to add this basic but very useful piece of information on the types of data that can be linked between nodes.

Types of Data

In a flowgraph there are different kinds of information that can pass from a node to another, the type of information that’s outputted from a node can be seen from the output’s arrow color:
  • Dark Blue: Boolean value (0 for false / 1 for true)
  • Light Blue: String (this can contain numbers and letters, e.g "Mission Success" or "The Code is 1234" etc…)
  • Red: Integer value (whole numbers such as 0, 1, 2 etc…)
  • White: Float value (numbers that can include decimal places eg. 0.23, 4.738 etc…)
  • Pink: Vector (a position or angle in relation to the map eg. (1,0,1), (23,1,2); etc…)
  • Green: Any/Signal - this kind of port can pass all the above types of information through.

Usually you can link an output to an input only when they are of the same kind; you can link everything to a green input/output, but be sure that the data that arrives to the input is of the right type. However, compatible ports (integer to float for example) are allowed to link together; you will recieve an error message of your linking is incorrect.
 ______________________________________________________________

I found this tutorial which could possibly help me with what I was trying to do for the Week 1 task. It would also be useful in data analysis to change material parameters on objects as AI's get closer/ further away or time of day changes (for example).

Flowgraph Walkthrough

The String:SetString nodes contain the file paths to the new material which are to be assigned to our object. In this example on game start every 5 seconds the material of the object will change. The string paths of the materials are sent via a Logic:Any node to the Entity:Material node which performs the material swtiching. 
I found this on Ros's blog which again could help me.
______________________________________________________________

Flowgraph Tutorial


This flowgraph creates data that measures the distance between the player and the object over a certain amount of time. It stores the data in an external xml docment which gives the total distance covered over that time frame.

 This section of the flowgraph creates a new external xml document called 'sum' which is saved in the mods folder.

 This section of the flowgraph finds the distance between the player and the object.

This section of the flowgraph finds the total average of the distance covered between the player and the object.

This section of the flowgraph saves the data into the 'sum' xml docuement.

S.W.O.T Analysis of Pachbe Feed

I have chosen Creating Space with Light Pachube feed from ARCH1391.

"The sense of space is created using light. The number of people entering and leaving a room directly correlates to the floor area which is lit up. As more people enter the room the lit floor area increases. As more of the floor area lights up the concept of a larger space is created."

There is currently no data available.
__________________________________________________________

S.W.O.T Analysis 
 
Strengths 
This idea is innovative and could quite easily lend itself to architecture in sustainability. Rather than having a fixed amount of light for a defined space (being the same for both 1 person in the room as 100 people in the room) the becomes organic in that it is ever changing in tune with the amount of people that are in the room. There is no need for a switch to be flicked as one enters the room and the. There is also the possibility that as more people enter the room the brightness of the light will give a sense or a larger space, avoiding the potential concern to leave a room due to overcrowding or feeling enclosed.    
Weaknesses 
Firstly, there is a possibility, if the right lights are not used, that the increasing light could cause an obstruction to ones vision. As light shines upwards it is directed into ones eyes, and therefore, when the light is at it's brightest, it could feel like you could not escape the sense of light beaming into your vision. Secondly, light is usually directed in-line of vision and one can connect with light in the direction of where they are looking. If light is coming up from the ground, it could potentially give a sense that there is something looking up from below.
Opportunities 
In regards to an entertainment centre environment, this idea could be used for light shows, as more and more people enter the hall the brighter the light show gets. Having a light show on the ground would be an interesting concept at a concert. In a museum/ art gallery this idea could be used to firstly create the sense of space that this idea is initially based on, but also to create information about how many people are in a particular area of the gallery. If, for example, you could see light coming from a part of the gallery you would know to maybe come back later as there is obviously lots of people already in that room.
Threats 
I'm not sure exactly of what is meant by 'threats' but I can imagine there would be threats to eyesight if the incorrect type of lights were used. Or there could be threats to budgets, as I could imagine that making a floor that was lit would be very expensive!

EXP 2: Analysing Parameters Vid


The parameters that are being analysed in this video is the height that the AI's are at in the environment ie. as the AI walks up the stairs it gets to a higher height.

Monday 22 August 2011

development of installation


Standing Tall: Apartment in Katayama by Mitsutomo Matsunami


I have chosen to model the apartment building to house my installation as the modern clean lines will help enhance the lighting projections that the data will be giving off. This picture here shows how much the building stands out from its surrounding environment; I want to get this effect on my war ship as well... I want to create the juxtaposition of residential living with the way of life at war. This juxtaposition is a reference to the way we perceive war on a societal level compared to that of the people who are actually out there fighting the war... the reality.
My Model so far:


mode for documentary

I have chosen to uses a combination of expository, observational and reflexive. My main aim in my documentary is to make the viewer feel as if they are in the installation themselves. The documentary poses questions about what is happening which would be the types of questions that would go through someones mind if they were exploring the installation themselves.

Saturday 13 August 2011

150 word description related to chosen pachube feed


I have chosen to go with the data from the feed that was monitoring the light. I can relate this closely with the idea that pure war is based on a society level as the feed is monitoring the home. For my concept it is going to be related to an apartment building where light only gets in at certain times of day because there may be a tree in the way or it may be from artificial light. The artificial light is what I'm going to be focusing on... it will be the lights that comes from the tv. If someone watches tv when they go to sleep they might turn the light off then turn the tv on, creating an artificial light. This also directly links in with my ideas about Virilio as it is the tv that is creating the representations of what is meant to be reality. We are so disconnected from reality because we can only get as close to it as the tv.


Further brainstorming:
- the "machines" (my objects that I created in sketchup) will hold the data that the tv recieves to project "reality"
- disconnection from reality
- objects/ images appear real but as you get closer tothem they dissappear or are fake

piano staircase


tutorials

 Animating the Time of Day

 Scale an Object with Time of Day

Reading an XML File in Flowgraph

Monday 8 August 2011

pure war!


I started out thinking of the shape of a barrel of a pistol and created this model from that. The reason why I chose a pistol as my starting point is because in today's society people seem to be removed from the real war of the world and are more focused on the war that is based on a society level. When were hear of shootings or murders we associate this with a pistol rather than a rifle or tank... the real weapons of war. This idea is derived from Paul Virilio's focus on technology and the thought of speed ie. technology = today/ current/ future and speed = the death of a human being from one pull of the trigger.


This is the texture that I created for my model. The images I chose related to Paul Viriolio's work (including soome of his sketches) and the idea of speed vs technology vs military and their weapons.

alter custom material parameters


I had a go at playing with the material parametres and found that opacity was the only other one that I could get an effect with. I used this on the custom chasis material that I made earlier but as you can see from the video it looks more like the glow parameter.

change standard material


I have changed the standard material but it looks as though I might need to use the UV Mapping that Russell mentioned in his tutorial for this one.

Monday 25 July 2011

pachube.com

MY CHOSEN FEED:

I had never heard of an arduino before, in fact I had never heard of anything like the pachube website before, how on earth do you stumble across a site like this? What's more is, how on earth do you understand this website!
At first glance, I was un-interested and confused, until I noticed a recurring theme of the arduino (see http://www.wired.com/gadgetlab/2008/04/just-what-is-an/ for what I think is a pretty good explanation.
The feed that I have chosen (link at the top of this post) as the one which interested me the most on the pachube website is titled "Home Monitoring". A brief explanation follows..."Domotics project: Two Arduinos control the home and measure stuff, they talk to each other using I2C. One of them communicates via USB with an apache webserver which interfaces the house with my iPhone or any web-enabled device at the time it sends data to Pachube for data logging. It all runs on backup batteries in case there is a power outage. A third Atmega uC watchdogs the two main units if they ever freeze."
 The arduino is controlling things such as room temp, light, power supply and the alarm system in someone's home in Satiago, USA.
Hmm, interesting!
 
 Photo: "Blog; The Geek Whisperer" http://geekwhisperin.wordpress.com/2011/02/03/arduino-is-the-future/, accessed 25 Jul 2011.